


Methods of Data Collection & Data Transformation
For Data Analysis and Data Visualizations

Introduction
The field of Data and Visual Analytics has emerged as a critical discipline, integrating techniques and tools for analyzing and visualizing data at scale 1. This interdisciplinary field combines aspects of computer science, statistics, and design to extract meaningful insights from increasingly large and complex datasets. Its importance spans numerous domains, from business intelligence and scientific research to healthcare and social sciences 2.
The ability to effectively analyze and visualize data is closely connected to broader concepts within data science, machine learning, and artificial intelligence, where data serves as the fundamental building block for developing models and extracting knowledge 2. The types of data encountered in this field are varied, ranging from structured numerical data to unstructured text and multimedia content 1.
Effective analysis hinges on the complementary use of computational methods and visual representations, allowing analysts to explore patterns, identify trends, and communicate findings effectively 1.
Data collection and data transformation are fundamental prerequisites for any meaningful endeavor in data analysis and visualization 4. Raw data, in its original form, is often unsuitable for direct analysis. It may be incomplete, contain errors, be formatted inconsistently, or reside in disparate systems 5. The process of data collection provides the initial raw material, while data transformation acts as a crucial value-adding step that prepares this raw data for generating reliable and actionable insights 5. Without proper attention to these foundational processes, the quality and reliability of any subsequent analysis and visualization can be severely compromised 8. Poor data quality can lead to flawed conclusions, misguided decisions, and ultimately undermine the objectives of data-driven initiatives 9.
Therefore, a thorough understanding of data collection methods and transformation techniques is essential for students aspiring to excel in the field of Data and Visual Analytics.
These processes are often initial stages in broader frameworks for data analysis, such as the OSEMN framework (Obtain, Scrub, Explore, Model, Interpret), where obtaining and scrubbing (cleaning and transforming) data are critical first steps 2.
Upon completion of this 4-hour module, students will be able to:
Identify and describe various methods of primary and secondary data collection relevant to data and visual analytics.
Evaluate the advantages and disadvantages of different data collection techniques and determine their appropriate applications.
Locate and critically assess the reliability and relevance of secondary data sources.
Apply fundamental data cleaning techniques to handle missing values, outliers, and inconsistencies in datasets.
Utilize different methods for integrating data from multiple sources into a unified format.
Explain the principles and apply basic techniques for data reduction, including dimensionality reduction and feature selection.
Perform data discretization to convert continuous data into categorical data for specific analytical purposes.
Articulate the critical importance of data quality and ethical considerations throughout the data collection and transformation processes.
Recognize and provide examples of real-world applications of different data collection and transformation methods in data analytics projects.
Understand the typical structure and learning objectives of a module on data collection and transformation within a BTech Data and Visual Analytics curriculum.
Explain how the concepts of data collection and transformation are fundamental to the broader field of data and visual analytics.
Exploring Methods of Primary Data Collection
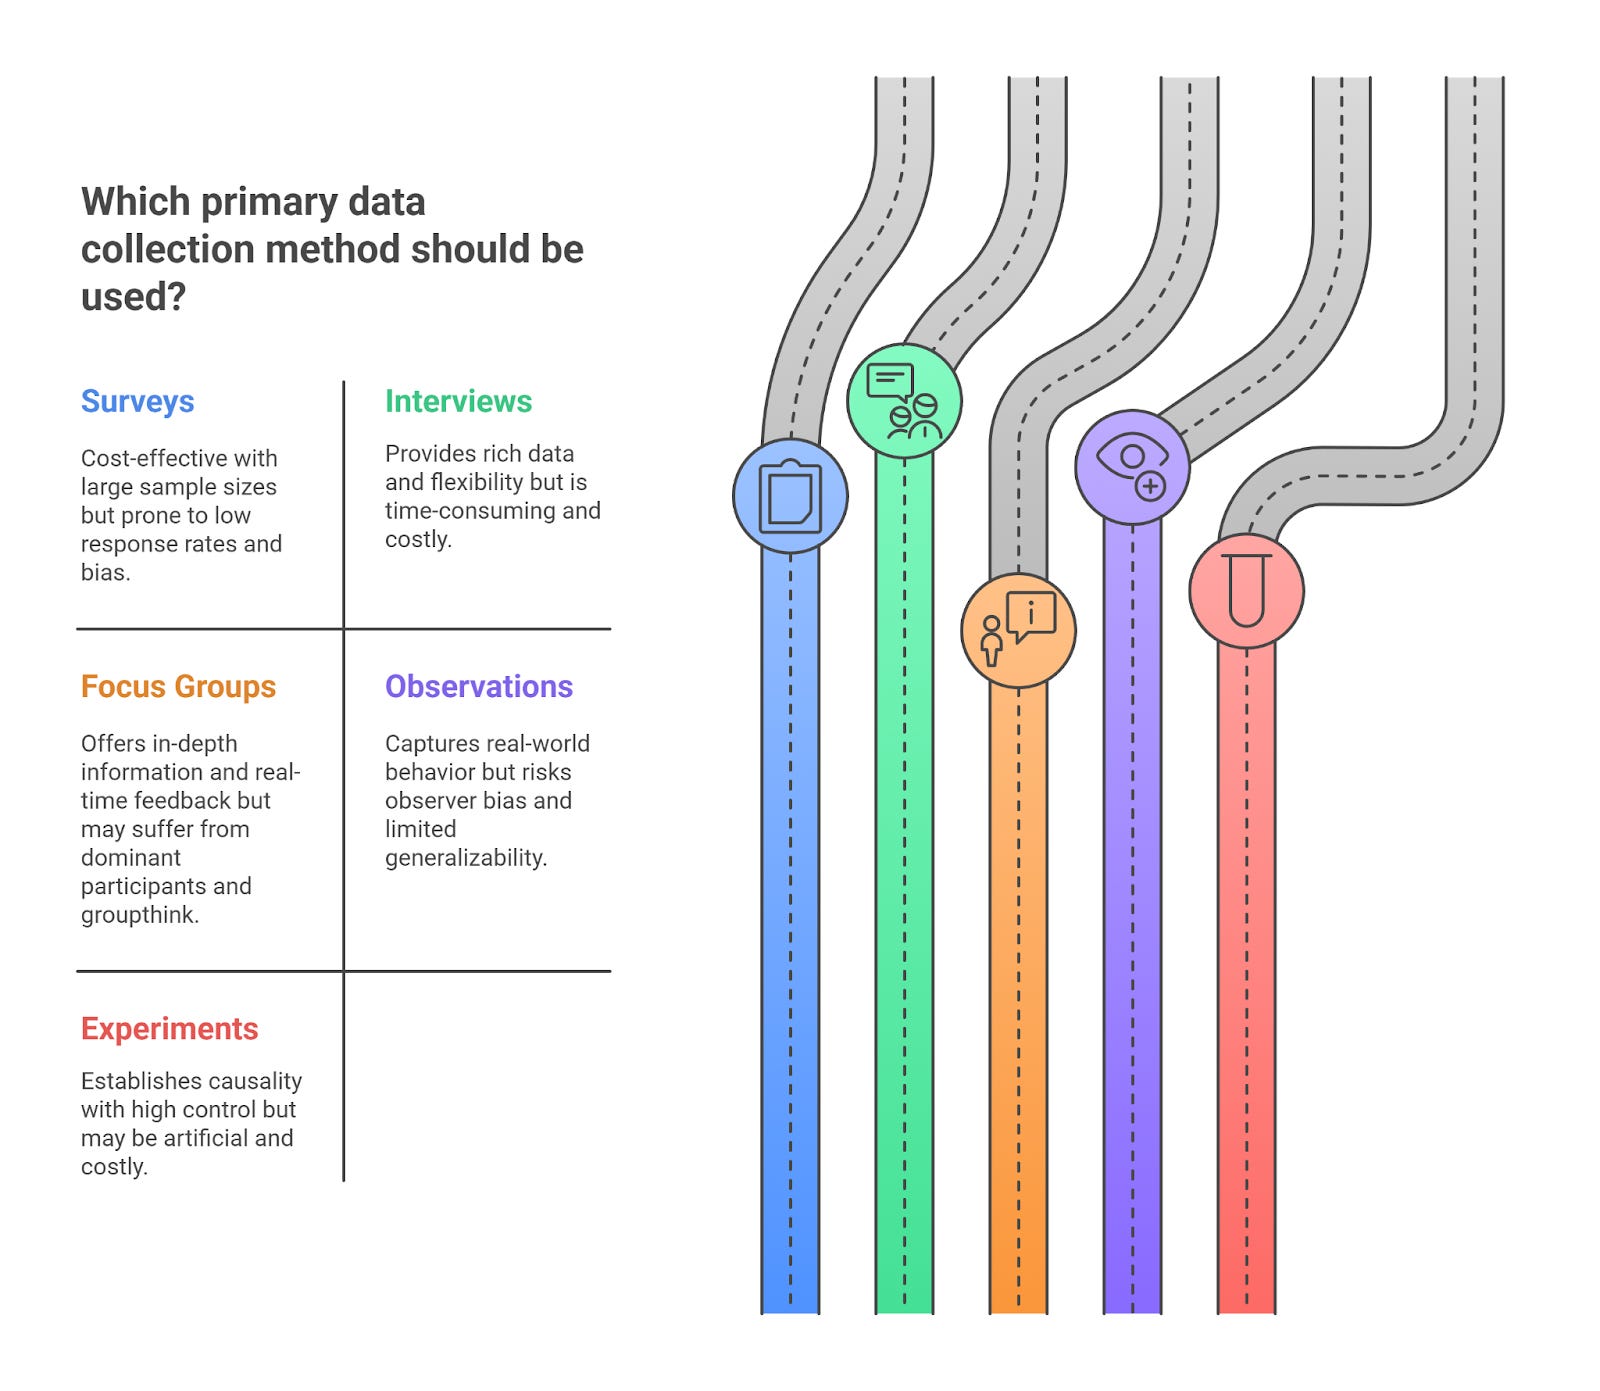
Primary data collection involves gathering original data directly from the source to answer specific research questions 13. Several methods are commonly employed to collect primary data in the field of data and visual analytics, each with its own strengths and limitations.
Surveys
Surveys are a widely used method for collecting data from a specific group of people, often to gather information about their opinions, preferences, experiences, knowledge, or behaviors 4. Surveys can be administered through various channels, including online platforms, mail, telephone calls, and in-person interviews 4. Effective survey design is crucial for obtaining usable and high-quality data.
This involves careful consideration of question wording to avoid ambiguity and bias, as well as a logical and well-structured questionnaire 13.
Surveys offer several advantages, including cost-effectiveness, particularly when administered online or by mail, allowing researchers to reach a large sample size relatively inexpensively 15. They also provide a standardized way of collecting data, ensuring that all respondents answer the same questions, which facilitates comparison of responses 15. Furthermore, surveys, especially self-administered ones, can offer respondents a greater sense of anonymity, potentially encouraging more honest responses on sensitive topics 17.
However, surveys also have disadvantages. Response rates can be low, which may affect the representativeness of the sample 16. There is also the potential for respondent bias, where individuals may provide socially desirable answers or interpret questions differently than intended 16. Unlike interviews, surveys typically lack the flexibility for follow-up questions or probing for more detailed information 17.
In data and visual analytics, surveys can be applied in various contexts, such as assessing customer satisfaction with a product or service, conducting opinion polls on specific topics, or gathering demographic information for segmentation analysis 4.
Interviews
Interviews involve direct interaction between a researcher and a respondent to gather in-depth information 13. Interviews can be categorized into structured, semi-structured, and unstructured formats 13. Structured interviews follow a predetermined set of questions asked in a specific order, offering high standardization but limited flexibility 13. Semi-structured interviews use a guide of topics or questions, but allow the interviewer to deviate and ask follow-up questions based on the respondent's answers, providing a balance between structure and flexibility 13.
Unstructured interviews are more conversational and exploratory, with no predetermined questions, allowing the interview to evolve based on the interaction 13. Conducting effective interviews requires establishing rapport with the participant to make them feel comfortable and encourage insightful responses, particularly on sensitive topics 23. Asking open-ended questions and practicing active listening are also crucial for eliciting detailed and meaningful information 23.
The advantages of interviews include the ability to gather rich and detailed data, allowing for a deeper understanding of individual experiences, perspectives, and motivations 15. The flexibility to probe and ask follow-up questions enables researchers to explore topics in greater depth and clarify any ambiguities 15. In face-to-face interviews, researchers can also observe non-verbal cues, such as body language and facial expressions, which can provide additional context and insights 21. However, interviews are often more time-consuming and costly to conduct and analyze compared to surveys 15. There is also a greater potential for interviewer bias, where the interviewer's behavior or questioning style might influence the respondent's answers 17. Interviews typically offer less anonymity than surveys, which might affect respondents' willingness to share sensitive information 21.
Due to the resource-intensive nature, interviews are often conducted with smaller sample sizes 21. In data and visual analytics, interviews can be valuable for understanding user needs and requirements for new software, gathering expert opinions on industry trends, or exploring complex issues in depth 20.
Focus Groups
Focus groups bring together a small group of participants (typically 6-10) to discuss specific topics under the guidance of a moderator 13. The primary purpose of focus groups is to explore group dynamics, gather diverse perspectives, and gain insights into participants' attitudes, perceptions, and beliefs about a particular subject 13. The moderator plays a crucial role in facilitating the discussion, ensuring that all participants have an opportunity to contribute, and keeping the conversation focused on the research objectives 15. A discussion guide, outlining the key topics and questions to be covered, is typically used to structure the session 15.
Focus groups can be conducted in traditional in-person settings or online, and variations like mini-focus groups (with fewer participants) are also common 24.
Focus groups offer the advantage of collecting in-depth information and real-time feedback from multiple individuals simultaneously, making them relatively cost-effective compared to conducting numerous individual interviews 15. The interaction between participants can often reveal insights and perspectives that might not emerge in individual interviews or surveys, allowing for the exploration of complex issues in detail 15. Researchers can also observe non-verbal cues and group dynamics, gaining a richer understanding of participants' reactions and opinions 24.
However, focus groups also have potential drawbacks. The presence of dominant participants can sometimes skew the conversation, overshadowing the opinions of quieter members 15. Groupthink, where participants feel pressure to conform to the majority view, can also limit the diversity of perspectives 15.
Engaging a large group effectively can be challenging, and the analysis of focus group data, which often involves transcribing and coding discussions, can be time-consuming 24. Focus groups are frequently used in data and visual analytics for understanding customer preferences for new products or services, testing marketing campaigns, or exploring user experiences with software applications 13.
Observations
Observation involves systematically watching and recording behavior in a natural setting without direct interaction with the subjects 4. Observation can be participant or non-participant. In participant observation, the researcher becomes part of the group being studied, actively participating in the activities while recording observations 33. In non-participant observation, the researcher observes from a distance without getting involved 33.
Observations can also be structured, using a specific checklist or predefined criteria for recording behaviors, or unstructured, where the researcher takes detailed notes on whatever seems relevant 33. Conducting observations effectively requires clear objectives, unbiased recording of observations, and careful consideration of ethical implications, such as obtaining necessary permissions and ensuring privacy 15.
The advantages of observation include the ability to capture real-world behavior in its natural context, providing rich and authentic data 15. It can offer flexibility in data collection, allowing researchers to adjust their focus as new insights emerge 33. Observation can also provide valuable contextual information about the environment and interactions surrounding the observed behavior 32.
However, observation also has limitations. There is a potential for observer bias, where the researcher's own beliefs or interpretations might influence what they observe and record 15. The Hawthorne effect, where individuals alter their behavior because they know they are being observed, can also affect the validity of the data 33. Observation typically provides only surface-level data, making it difficult to understand the underlying motivations or reasons behind the observed actions 31.
It can also be time-consuming to collect enough data through observation, and the findings might have limited generalizability to other settings or populations 32. In data and visual analytics, observation can be used for usability testing of websites or software, studying user interactions with interfaces, or understanding customer behavior in retail environments 13.
Experiments
Experiments are a data collection method designed to establish cause-and-effect relationships between variables 4. A typical experiment involves manipulating one or more independent variables to observe their effect on a dependent variable, while controlling for other extraneous factors 4.
Key elements of experimental design include identifying the independent and dependent variables, establishing control and experimental groups, and using random assignment to ensure that participants are equally likely to be in either group 4. Experiments can be conducted in controlled laboratory settings or in real-world field environments 38.
The primary advantage of experiments is their ability to establish causality, allowing researchers to determine whether a specific intervention or manipulation leads to a particular outcome 36. Experiments offer a high level of control over the variables being studied, increasing the reliability and validity of the findings 40. The structured nature of experiments also allows for replication by other researchers, further strengthening the validity of the results 37.
However, experiments conducted in laboratory settings might suffer from artificiality, where participants behave differently than they would in natural situations, potentially limiting the external validity or generalizability of the findings 36. Ethical constraints can also arise, particularly when experimenting with human participants, as certain manipulations might be harmful or unethical 36.
Setting up and conducting well-controlled experiments can also be expensive and time-consuming 36. In data and visual analytics, experiments are commonly used for A/B testing to compare different versions of websites, applications, or marketing materials to see which performs better, or for evaluating the effectiveness of specific interventions or features 4.

Understanding Sources of Secondary Data
Secondary data refers to data that has already been collected by someone else for a purpose other than the current research question 13. Utilizing secondary data can save time and resources compared to collecting primary data, and it can provide access to information that might otherwise be difficult or impossible to obtain 36.
Types of Secondary Data Sources
A wide array of secondary data sources is available, providing information across various domains. Government Publications are a significant source, often containing census data, statistical reports, and other official records 43. These sources are frequently freely accessible and offer valuable demographic, economic, and social data 43. Research Reports, including academic papers, market research reports, and industry analyses, present findings from previous studies and can offer in-depth insights into specific topics 13. These reports have often undergone rigorous review processes, enhancing their credibility 13.
Industry Databases provide specialized information related to particular sectors, such as financial data, company profiles, and market trends 43. These databases are often maintained by industry associations, trade bodies, or private companies 43.
Online Repositories have become increasingly important sources of secondary data, encompassing open data platforms, institutional repositories, and even data available from social media, internet searches, and app usage 43. These online sources offer a vast amount of readily accessible information, though their reliability can vary 44.
Evaluating the Reliability and Relevance of Secondary Data Sources
Critically evaluating secondary data sources is essential to ensure the quality and appropriateness of the information used for analysis 48. Assessing the credibility of the source involves considering the author's expertise, their academic or professional credentials, and the reputation of the publishing organization or institution 48. Understanding the purpose and potential biases of the data provider is also crucial. Data collected by commercial businesses or political organizations, for example, might have an inherent bias that needs to be considered 49.
Evaluating the methodology used for data collection, including the sampling techniques and data analysis methods employed, can provide insights into the rigor and potential limitations of the data 49. Checking the date of data collection is important to ensure that the information is timely and relevant to the current research context, especially in rapidly evolving fields 49.
Verifying consistency with other sources, also known as triangulation, involves comparing the data with information from multiple independent sources to identify any discrepancies and strengthen the reliability of the findings 48. Finally, it is paramount to assess the relevance of the data to the specific research question, ensuring that the information directly addresses the analytical objectives 49.

Best Practices for Utilizing Secondary Data:
When utilizing secondary data, it is advisable to first clearly define the research questions to guide the search for relevant information 14. Developing a systematic search strategy can help in efficiently identifying appropriate sources.
It is also good practice to document all sources that are used, including how the data was accessed. Recognizing and acknowledging the limitations of secondary data, such as potential biases or inconsistencies, is important for a balanced interpretation of findings. Finally, synthesizing information from multiple sources can lead to a more comprehensive and nuanced understanding of the topic under investigation.
Techniques for Data Transformation
Data transformation is the process of converting raw data into a format that is suitable for analysis and visualization 54. This often involves several key techniques, including data cleaning, data integration, data reduction, and data discretization.
Data Cleaning
Data cleaning is a critical step in preparing data for analysis, involving the identification and correction of errors, inconsistencies, and inaccuracies 55. This process ensures that the dataset is reliable and accurate for generating meaningful insights 59.

Handling Missing Values: Missing values are a common issue in datasets and can arise for various reasons 60. Understanding the type of missing data, whether it is Missing Completely At Random (MCAR) or Missing At Random (MAR), can inform the choice of handling technique 61. Common techniques include removal of rows or columns with missing values, particularly if the missingness is minimal and random 58.
Imputation involves replacing missing values with substituted data. This can be done using the mean or median for numerical data, the mode for categorical data, a constant value based on domain knowledge, or even through prediction using regression or classification models 57.
Another approach is flagging missing values by adding a new column indicating whether a value was originally missing, which can be useful for tracking the impact of missing data on the analysis 60.
Handling Outliers: Outliers are data points that deviate significantly from the rest of the data and can distort statistical analysis 57. Outliers can be identified using visual methods such as box plots and scatter plots, which can highlight data points that fall far outside the typical range 57. Statistical methods like the Z-score (measuring how many standard deviations a data point is from the mean) and the Interquartile Range (IQR) method (identifying values outside a defined range based on quartiles) can also be used for outlier detection 57.
Techniques for handling outliers include removal of the outlier data points, capping or flooring the outlier values to a predefined threshold, imputation by replacing outliers with the mean or median, or applying transformations such as log or square root transformations to reduce the impact of extreme values 57.
Handling Inconsistencies: Inconsistencies in data can arise from various sources, such as different data entry practices, variations in formatting, or typos 57. Identifying these inconsistencies is crucial for ensuring data quality 67.
Techniques for resolving inconsistencies include standardization of data formats (e.g., ensuring all dates are in the same format, converting text to consistent casing), validation against predefined rules or external datasets to identify errors, and correction of errors through manual editing or automated scripts 58.
Data Integration
Data integration involves combining data from multiple sources into a unified dataset 55. This is often necessary when data relevant to an analysis is spread across different databases, applications, or file formats 71.

Integrating data can be challenging due to differences in data formats, schemas (the structure of the data), and data quality issues across the sources 55. Common techniques for data integration include concatenation (appending datasets together), merging or joining datasets based on common fields, establishing a data warehouse (a central repository for integrated and transformed data), and using data federation or virtualization (creating a virtual layer that allows access to data from multiple sources without physically moving it) 55.
ETL (Extract, Transform, Load) and ELT (Extract, Load, Transform) processes are also widely used for data integration, involving extracting data from sources, transforming it to meet requirements, and loading it into a target system 55.
Data Reduction
Data reduction techniques aim to reduce the volume of data while preserving the essential information needed for analysis 57. This can improve computational efficiency, reduce storage requirements, and sometimes enhance model performance by removing irrelevant or redundant information 75.

Dimensionality Reduction: Dimensionality reduction focuses on reducing the number of features or variables in a dataset 57. This is particularly useful when dealing with high-dimensional data, which can suffer from the "curse of dimensionality" and lead to overfitting in machine learning models 79.
Techniques for dimensionality reduction include Principal Component Analysis (PCA), a linear technique that transforms the original variables into a new set of uncorrelated variables called principal components, which capture most of the variance in the data 57. Feature selection methods aim to select a subset of the most relevant features from the original dataset, either by ranking features based on statistical metrics (filter methods), evaluating the performance of a model with different feature subsets (wrapper methods), or incorporating feature selection within the model building process (embedded methods) 57.
Feature Selection: Feature selection is a specific type of dimensionality reduction that focuses on identifying and selecting the most informative and discriminative features for predicting a target variable 57. The goal is to improve model performance, reduce overfitting, and enhance the interpretability of the model by focusing on the most relevant aspects of the data 57.
Common feature selection techniques include correlation analysis to identify features highly correlated with the target variable, information gain to measure the reduction in entropy after including a feature, recursive feature elimination (RFE) which iteratively removes the least important features, and L1 regularization (Lasso) which penalizes less important features, effectively driving their coefficients to zero 80.
Data Discretization
Data discretization is the process of converting continuous numerical data into a finite set of discrete intervals or categories 75.

This technique can simplify the data, make it easier to analyze, and improve the performance of certain algorithms that work better with categorical inputs 75. Common discretization techniques include equal-width binning, where the range of continuous values is divided into equal-sized intervals, equal-frequency binning, where the data is divided into bins containing approximately the same number of data points, clustering-based discretization, which uses clustering algorithms to group similar values into bins, and histogram analysis, which uses the distribution of data to define bin boundaries 75.
The Importance of Data Quality and Ethical Considerations
Ensuring high data quality and adhering to ethical principles are paramount throughout the data collection and transformation processes. These considerations are crucial for generating reliable insights and maintaining trust in data-driven decision-making 8.
Defining and Ensuring Data Quality
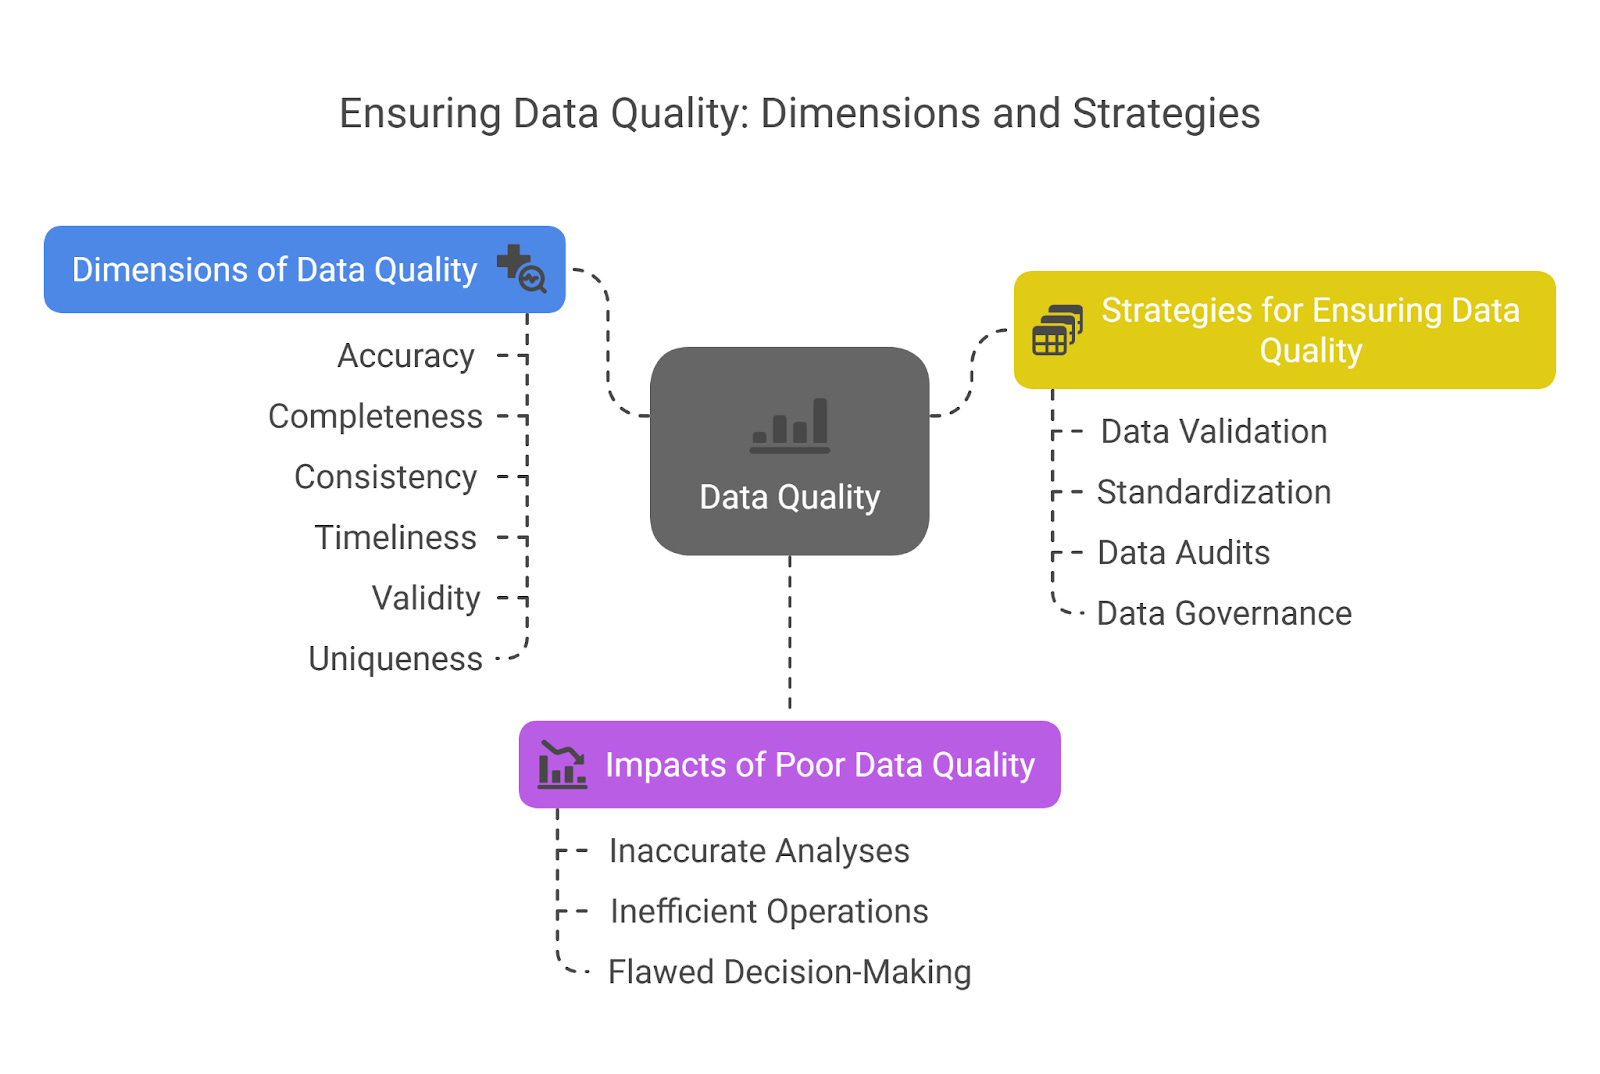
Data quality refers to the condition of data in terms of its fitness to serve its intended purpose 12. Several dimensions are commonly used to assess data quality, including accuracy (the extent to which data represents real-world values), completeness (whether all necessary data is present), consistency (uniformity of data across different datasets or systems), timeliness (data being up-to-date and available when needed), validity (data conforming to defined business rules and constraints), and uniqueness (absence of duplicate records) 11.
Poor data quality can have significant negative impacts, leading to inaccurate analyses, inefficient operations, flawed decision-making, and ultimately, a lack of trust in the data 8. Strategies for ensuring data quality throughout the collection and transformation processes include implementing data validation checks to prevent inaccurate data from entering the system, applying standardization techniques to ensure consistency, conducting regular data audits to identify and rectify errors, and establishing clear data governance policies and procedures 12.
Ethical Principles in Data Collection
Ethical data collection involves adhering to moral principles that guide how data is gathered and used, respecting the rights and privacy of individuals 90. Informed consent is a fundamental principle, requiring that individuals are fully informed about the nature of the data being collected, how it will be used, and any potential risks involved, and that they provide explicit permission for this collection and use 15. Protecting privacy and confidentiality is also crucial, ensuring that personal information is safeguarded from unauthorized disclosure and that anonymity is maintained where appropriate 15.
The principle of data minimization dictates that only the data strictly necessary for the specific purpose should be collected and retained 92. Finally, transparency and accountability in data handling are essential, requiring organizations to be open about their data practices and to take responsibility for ensuring ethical conduct throughout the data lifecycle 90.
Ethical Considerations in Data Transformation
Ethical considerations extend to the data transformation phase as well. It is important to avoid introducing or perpetuating bias during data cleaning and preprocessing, which could lead to unfair or discriminatory outcomes, particularly for marginalized groups 91. Ensuring fairness and equity in data transformation processes means striving for equitable treatment for all individuals and mitigating the risks of bias in data-driven decision-making 91.
Maintaining data integrity and accuracy throughout the transformation process is an ethical imperative, ensuring that the original data is not compromised 90. Finally, it is crucial to consider the responsible use of transformed data and to be mindful of the potential for misuse, such as for discriminatory or manipulative purposes 90.
Illustrative Case Studies and Real-World Applications
The concepts of data collection and transformation are best understood through practical examples and real-world applications.
Case Studies Demonstrating Various Data Collection Methods
Surveys are extensively used for market research to gauge customer opinions on new products or services 13. Interviews are valuable in understanding user experience with software applications, allowing researchers to gather detailed qualitative feedback on usability and design 20. Focus groups are often employed for product development feedback, bringing together potential users to discuss their needs and preferences for new product features 13.
Observations are crucial in studying consumer behavior in retail settings, providing insights into how customers interact with products and make purchasing decisions 13. Experiments, particularly A/B testing, are widely used by online platforms to compare different versions of web pages or app features to optimize user engagement and conversion rates 4.
Examples of Data Transformation Techniques in Practice
Data cleaning is exemplified in scenarios where customer databases are scrubbed to correct typos in names and addresses and to standardize phone number formats across different entry systems 58. Data integration is commonly seen in e-commerce businesses that combine customer purchase history from their website with marketing data from email campaigns and social media engagement data to create a holistic view of the customer 70.
Dimensionality reduction techniques like PCA are applied in gene expression analysis to reduce the thousands of gene features to a smaller set of principal components that capture the most significant variations in the data, facilitating further analysis and modeling 79.
Data discretization is used in credit risk assessment where continuous variables like income and credit score are converted into categorical risk levels (e.g., low, medium, high) for building classification models 85.
Data normalization and standardization are essential in machine learning to ensure that numerical features are on a similar scale, preventing features with larger values from unduly influencing the model training process 56.
Connecting Data Handling to Successful Analytics Projects
Effective data collection and transformation are often the backbone of successful data analytics projects. Companies like Siemens leverage data analytics to improve production efficiency by collecting and analyzing sensor data from their equipment 95. Amazon personalizes the shopping experience by transforming vast amounts of customer purchase history, browsing behavior, and search history to recommend relevant products 42. Netflix analyzes user viewing patterns to predict future content preferences, relying on robust data collection and transformation pipelines 42. Walmart uses data mining to improve its supply chain by identifying patterns in sales, inventory levels, and transportation costs 96.
These examples underscore how well-prepared data, resulting from effective collection and transformation, enables organizations to gain significant business insights and improve their operations 42.
Furthermore, data visualization projects inherently benefit from well-prepared data, as the clarity and accuracy of the visualizations directly depend on the quality of the underlying data that has been appropriately collected and transformed 97.
The Fundamental Role of Data Collection and Transformation in Data and Visual Analytics
Data collection and transformation are not merely preliminary steps but are foundational to the entire process of extracting meaningful insights from data 4. These processes are essential for ensuring that the data used for analysis and visualization is accurate, consistent, and in a suitable format.
The process of data transformation is often iterative, involving data discovery, mapping, code generation, execution, and review, highlighting that it is not always a linear sequence 59. Insights gained from initial analysis might necessitate further data collection or refinement of transformation techniques, emphasizing the cyclical nature of data analytics 59.
Mastering the skills and concepts related to data collection and transformation is therefore crucial for students aspiring to succeed in the dynamic and increasingly important field of data and visual analytics 3.
Conclusions
This courseware module provides a comprehensive overview of the methods of data collection and data transformation, essential components of the field of Data and Visual Analytics. By exploring various primary and secondary data collection techniques, students gain an understanding of how data is sourced and the importance of choosing appropriate methods for different research questions. The module also delves into a range of data transformation techniques, equipping students with the skills to clean, integrate, reduce, and discretize data in preparation for analysis and visualization.
References :
1. CSE 6242: Data and Visual Analytics - OMSCS - Georgia Tech, accessed on March 20, 2025, https://omscs.gatech.edu/cse-6242-data-and-visual-analytics
2. Syllabus of UNDERGRADUATE DEGREE COURSE B.Tech. V Semester Computer Science & Engineering (Data Science) Rajasthan Technical University, Kota, accessed on March 20, 2025, https://rtu.ac.in/index/Adminpanel/Images/Media/02092023044059-media.pdf
3. Data Analytics and Digital Transformations - YouTube, accessed on March 20, 2025,
4. 2.1 Overview of Data Collection Methods - Principles of Data Science | OpenStax, accessed on March 20, 2025, https://openstax.org/books/principles-data-science/pages/2-1-overview-of-data-collection-methods
5. Complete Guide to Data Transformation: Basics to Advanced - Ascend.io, accessed on March 20, 2025, https://www.ascend.io/blog/complete-guide-to-data-transformation-basics-to-advanced/
6. Data transformation vs. data visualization - Domo, accessed on March 20, 2025, https://www.domo.com/learn/article/data-transformation-vs-data-visualization
7. Chapter 4: Data Representations and Transformations: Illuminating the Path: The R&D Agenda for Visual Analytics - Simon Fraser University, accessed on March 20, 2025, https://www.sfu.ca/media-lab/DCM/CMNS%20387%20Visualization/CMNS387%20Visualization/NVAC%20National%20Visualization%20/RD_Agenda_NVAC_chapter4.pdf
8. firsteigen.com, accessed on March 20, 2025, https://firsteigen.com/blog/data-quality-management-key-to-digital-transformation-success/#:~:text=Data%20Quality%20Management%20(DQM)%20ensures,inefficiencies%2C%20and%20even%20project%20failure.
9. The importance of Data Quality in the age of Digital Transformation - Delta Capita, accessed on March 20, 2025, https://www.deltacapita.com/insights/the-importance-of-data-quality-in-the-age-of-digital-transformation
10. Data Quality Management: The Key to Digital Transformation Success - FirstEigen, accessed on March 20, 2025, https://firsteigen.com/blog/data-quality-management-key-to-digital-transformation-success/
11. 6 Pillars of Data Quality and How to Improve Your Data | IBM, accessed on March 20, 2025, https://www.ibm.com/products/tutorials/6-pillars-of-data-quality-and-how-to-improve-your-data
12. The Importance of Data Quality: Diving into the Intricacies of Ensuring Data Accuracy and Relevance - Institutional Research and Planning - Marshall University, accessed on March 20, 2025, https://www.marshall.edu/irp/2023/10/04/importanceofdataquality/
13. What Are Common Data Collection Methods? | Coursera, accessed on March 20, 2025, https://www.coursera.org/articles/data-collection-methods
14. What Is Data Collection: Methods, Types, Tools - Simplilearn.com, accessed on March 20, 2025, https://www.simplilearn.com/what-is-data-collection-article
15. Data Collection Methods - Research Experiences for Undergraduates - UNC Charlotte, accessed on March 20, 2025, https://reu.charlotte.edu/toolkit/analysis/data-collection-methods/
16. pmc.ncbi.nlm.nih.gov, accessed on March 20, 2025, https://pmc.ncbi.nlm.nih.gov/articles/PMC3964639/
17. The Advantages and Disadvantages of Surveys You Need to Know - Genroe, accessed on March 20, 2025, https://www.genroe.com/blog/pros-and-cons-of-surveys/11471
18. Online Survey Advantages and Disadvantages - Trustmary, accessed on March 20, 2025, https://trustmary.com/surveys/online-survey-advantages-and-disadvantages/
19. Pros and Cons of Survey Research - GitHub Pages, accessed on March 20, 2025, https://saylordotorg.github.io/text_principles-of-sociological-inquiry-qualitative-and-quantitative-methods/s11-02-pros-and-cons-of-survey-resear.html
20. Chapter 10. Introduction to Data Collection Techniques - Oregon State University, accessed on March 20, 2025, https://open.oregonstate.education/qualresearchmethods/chapter/chapter-10-introduction-to-data-collection-techniques/
21. 4.5 Data Collection Methods – An Introduction to Research Methods for Undergraduate Health Profession Students - JCU Open eBooks, accessed on March 20, 2025, https://jcu.pressbooks.pub/intro-res-methods-health/chapter/4-5-data-collection-methods/
22. Types of Interviews in Research | Guide & Examples - Scribbr, accessed on March 20, 2025, https://www.scribbr.com/methodology/interviews-research/
23. In-Depth Interviews: Data Collection Advantages and Disadvantages - Qlarity Access, accessed on March 20, 2025, https://qlarityaccess.com/qlarity/in-depth-interviewing
24. Focus Groups: Advantages and Disadvantages | Vaia, accessed on March 20, 2025, https://www.vaia.com/en-us/explanations/marketing/marketing-information-management/focus-groups/
25. Research Interviews | Disadvantages & Cautions - ATLAS.ti, accessed on March 20, 2025, https://atlasti.com/guides/interview-analysis-guide/disadvantages-of-research-interviews
26. www.vaia.com, accessed on March 20, 2025, https://www.vaia.com/en-us/explanations/marketing/marketing-information-management/focus-groups/#:~:text=The%20pros%20of%20a%20focus,analysis%20or%20shy%2Funcomfortable%20participants.
27. Focus Groups: The Definitive Guide - Qualtrics, accessed on March 20, 2025, https://www.qualtrics.com/experience-management/research/focus-groups/
28. 6 advantages and disadvantages of a focus group study - GrapeData, accessed on March 20, 2025, https://www.grape-data.com/blog/6-advantages-and-disadvantages-of-a-focus-group-study
29. Focus Groups vs. Interviews for Market Research - Rev, accessed on March 20, 2025, https://www.rev.com/blog/differences-in-focus-groups-vs-in-depth-interviews
30. Advantages/Disadvantages of focus groups, interviews & pre/post- tests - EMpower, accessed on March 20, 2025, https://empowerweb.org/assets/uploads/tools-resources/461/3._advantages_and_disadvantages_of_focus_groups,_interviews_and_pre-_and_post-tests.pdf
31. insight7.io, accessed on March 20, 2025, https://insight7.io/observation-market-research-advantages-and-disadvantages/#:~:text=While%20observation%20can%20yield%20authentic,and%20resources%20to%20implement%20effectively.
32. Observation Market Research Advantages and Disadvantages - Insight7, accessed on March 20, 2025, https://insight7.io/observation-market-research-advantages-and-disadvantages/
33. Balancing Act: The Strengths and Limitations of Observation Method - Journalism University, accessed on March 20, 2025, https://journalism.university/communication-research-methods/strengths-limitations-observation-method/
34. What is Observational Research: Types, Pros, and Examples - QuestionPro, accessed on March 20, 2025, https://www.questionpro.com/blog/observational-research/
35. Observation Method of Data Collection - Voicedocs, accessed on March 20, 2025, https://voicedocs.com/en/blog/observation-method-of-data-collection
36. Exploring the Different Methods of Collecting Data: Advantages and Disadvantages | by Dauletkhan Assanov | Medium, accessed on March 20, 2025, https://medium.com/@dauletkhan.assanov/exploring-the-different-methods-of-collecting-data-advantages-and-disadvantages-83770fa24a12
37. www.tutorchase.com, accessed on March 20, 2025, https://www.tutorchase.com/answers/a-level/psychology/what-are-the-benefits-and-limitations-of-experimental-research#:~:text=This%20can%20provide%20reliable%20results,for%20moral%20or%20logistical%20reasons.
38. The Pros and Cons of Using Experimental Methods in Media Research, accessed on March 20, 2025, https://journalism.university/communication-research-methods/pros-cons-experimental-methods-media-research/
39. What are the benefits and limitations of experimental research methods? - TutorChase, accessed on March 20, 2025, https://www.tutorchase.com/answers/a-level/psychology/what-are-the-benefits-and-limitations-of-experimental-research
40. Experimental Method : Advantages and limitations Degree Course (Three Years) Psychology Honours B. A. Part, accessed on March 20, 2025, https://rrscollegemokama.ac.in/study-material/1572486481experimental%20method.pdf
41. What is Primary Data Collection? Types, Advantages, and Disadvantages - resonio, accessed on March 20, 2025, https://www.resonio.com/blog/primary-data-collection-types-advantages-and-disadvantages/
42. Case Studies: Successful Data-Driven Transformations - Polar Packet, accessed on March 20, 2025, https://polarpacket.com/case-studies-successful-data-driven-transformations
43. What is Secondary Data? [Examples, Sources & Advantages] - CareerFoundry, accessed on March 20, 2025, https://careerfoundry.com/blog/data-analytics/what-is-secondary-data/
44. What is Secondary Data? Definition & Benefits - Code Institute Global, accessed on March 20, 2025, https://codeinstitute.net/global/blog/secondary-data/
45. DS & AI | IIT G - IIT Guwahati, accessed on March 20, 2025, https://www.iitg.ac.in/dsai/dsai_fifth_sem_btech.html
46. Types of Secondary Research Data – An Open Guide to Integrated Marketing Communications (IMC) - Kwantlen Polytechnic University, accessed on March 20, 2025, https://kpu.pressbooks.pub/openimc/chapter/primary-data-v-s-secondary-data/
47. What is Secondary Research? | Definition, Types, & Examples - Scribbr, accessed on March 20, 2025, https://www.scribbr.com/methodology/secondary-research/
48. www.freedoniagroup.com, accessed on March 20, 2025, https://www.freedoniagroup.com/blog/6-essential-questions-for-evaluating-secondary-data-sources#:~:text=Don't%20be%20afraid%20to,to%20consumer's%20opinions%20and%20needs.
49. 6 Essential Questions for Evaluating Secondary Data Sources - The Freedonia Group, accessed on March 20, 2025, https://www.freedoniagroup.com/blog/6-essential-questions-for-evaluating-secondary-data-sources
50. Evaluating primary and secondary sources - History Subject Resource Guide, accessed on March 20, 2025, https://libguides.hofstra.edu/c.php?g=323882&p=2171901
51. Accuracy, Reliability and Validity for secondary sources? - ATAR Notes, accessed on March 20, 2025, https://archive.atarnotes.com/forum/index.php?topic=191219.0
52. Secondary Research Advantages, Limitations, and Sources - Relevant Insights, accessed on March 20, 2025, https://www.relevantinsights.com/articles/secondary-research-advantages-limitations-and-sources/
53. [FREE] evaluate secondary data sources and the specific information you need from each source. insert or remove - Brainly, accessed on March 20, 2025, https://brainly.com/question/34240660?source=previous+question
54. Best Online Data Transformation Courses and Programs | edX, accessed on March 20, 2025, https://www.edx.org/learn/data-transformation
55. Understanding Data Transformation - Databricks, accessed on March 20, 2025, https://www.databricks.com/glossary/what-is-data-transformation
56. Most Common Data Transformation Techniques - Coupler.io Blog, accessed on March 20, 2025, https://blog.coupler.io/data-transformation-techniques/
57. Data Transformation in Machine Learning - GeeksforGeeks, accessed on March 20, 2025, https://www.geeksforgeeks.org/data-transformation-in-machine-learning/
58. Guide To Data Cleaning: Definition, Benefits, Components, And How To Clean Your Data, accessed on March 20, 2025, https://www.tableau.com/learn/articles/what-is-data-cleaning
59. Data Transformation: A Guide To What, Why, And How, accessed on March 20, 2025, https://www.rudderstack.com/learn/data-transformation/data-transformation-techniques/
60. Data Cleaning and Wrangling Guide - Research & Subject Guides at Stony Brook University, accessed on March 20, 2025, https://guides.library.stonybrook.edu/data-cleaning-and-wrangling/cleaning
61. How to Handle Missing Data Values While Data Cleaning - insightsoftware, accessed on March 20, 2025, https://insightsoftware.com/blog/how-to-handle-missing-data-values-while-data-cleaning/
62. 5 Easy Data Cleaning Techniques That Turn Garbage Into Gold, accessed on March 20, 2025, https://www.montecarlodata.com/blog-data-cleaning-techniques/
63. Data Cleaning and Handling Missing Data - The Examples Book, accessed on March 20, 2025, https://the-examples-book.com/tools/python/datacleaning-missing-data
64. Detecting and Treating Outliers | Treating the odd one out! - Analytics Vidhya, accessed on March 20, 2025, https://www.analyticsvidhya.com/blog/2021/05/detecting-and-treating-outliers-treating-the-odd-one-out/
65. Data Cleaning - Dealing with Outliers - Neural Data Science in Python, accessed on March 20, 2025, https://neuraldatascience.io/5-eda/data_cleaning.html
66. How to Handle Outliers in Dataset with Pandas - KDnuggets, accessed on March 20, 2025, https://www.kdnuggets.com/how-to-handle-outliers-in-dataset-with-pandas
67. 5 Data Cleaning Techniques - Tamr, accessed on March 20, 2025, https://www.tamr.com/blog/5-data-cleaning-techniques
68. Data Quality Issues: Incomplete, Inaccurate, or Inconsistent Data | by Configr Technologies, accessed on March 20, 2025, https://configr.medium.com/data-quality-issues-incomplete-inaccurate-or-inconsistent-data-2d5e98a9fa34
69. What is Data Transformation? | Informatica, accessed on March 20, 2025, https://www.informatica.com/resources/articles/what-is-data-transformation.html.html
70. Top 8 Data Integration Techniques & Strategies in 2024 - PixelPlex, accessed on March 20, 2025, https://pixelplex.io/blog/data-integration-techniques/
71. What is data integration? Tools, techniques and key concepts - Software AG, accessed on March 20, 2025, https://www.softwareag.com/en_corporate/resources/data-integration/article/data-integration.html
72. 7 Data Integration Techniques And Strategies in 2025 - Rivery, accessed on March 20, 2025, https://rivery.io/data-learning-center/data-integration-techniques-and-strategies/
73. Data Integration: 7 Popular Techniques & Methods - Domo, accessed on March 20, 2025, https://www.domo.com/learn/article/data-integration-techniques
74. What Is Data Integration? Types, Benefits & Best Practices - Matillion, accessed on March 20, 2025, https://www.matillion.com/blog/what-is-data-integration-the-ultimate-guide
75. Data Reduction in Data Mining - GeeksforGeeks, accessed on March 20, 2025, https://www.geeksforgeeks.org/data-reduction-in-data-mining/
76. Introduction to Dimensionality Reduction - GeeksforGeeks, accessed on March 20, 2025, https://www.geeksforgeeks.org/dimensionality-reduction/
77. Top 12 Dimensionality Reduction Techniques for Machine Learning - Encord, accessed on March 20, 2025, https://encord.com/blog/dimentionality-reduction-techniques-machine-learning/
78. Dimensionality reduction - Wikipedia, accessed on March 20, 2025, https://en.wikipedia.org/wiki/Dimensionality_reduction
79. What is Dimensionality Reduction? - IBM, accessed on March 20, 2025, https://www.ibm.com/think/topics/dimensionality-reduction
80. Feature Selection and Dimensionality Reduction Techniques | by Muhammad Dawood, accessed on March 20, 2025, https://muhammaddawoodaslam.medium.com/feature-selection-and-dimensionality-reduction-techniques-9d09ecee794f
81. Dimensionality Reduction and Feature Extraction - MathWorks, accessed on March 20, 2025, https://www.mathworks.com/help/stats/dimensionality-reduction.html
82. Effective Data Reduction Using Discriminative Feature Selection Based on Principal Component Analysis - MDPI, accessed on March 20, 2025, https://www.mdpi.com/2504-4990/6/2/37
83. Dimensionality Reduction VS Feature Selection | by Ankit Sanjyal - Medium, accessed on March 20, 2025, https://medium.com/@asanjyal81/dimensionality-reduction-vs-feature-selection-e68f91aa8724
84. iiitn.ac.in, accessed on March 20, 2025, https://iiitn.ac.in/Downloads/academic/BTech-CSE-DSA-Syllabus-02-01-2024.pdf
85. Data Discretization. What is it? Why is it needed? Types of… | by Devanshi Patel | CodeX | Medium, accessed on March 20, 2025, https://medium.com/codex/data-discretization-b5faa2b77f06
86. Data Disretization - Complexica, accessed on March 20, 2025, https://www.complexica.com/narrow-ai-glossary/data-disretization
87. Discretization in Data Mining: Techniques & Applications - Learning Lab, accessed on March 20, 2025, https://learninglabb.com/discretization-in-data-mining/
88. Data Discretization | Dagster Glossary, accessed on March 20, 2025, https://dagster.io/glossary/data-discretization
89. What is Discretization in Machine Learning? - Analytics Vidhya, accessed on March 20, 2025, https://www.analyticsvidhya.com/blog/2024/11/discretization/
90. Ethics in Data Collection: Why Responsible Web Scraping Matters - PromptCloud, accessed on March 20, 2025, https://www.promptcloud.com/blog/importance-of-ethical-data-collection/
91. Data Ethics: Examples, Principles and Uses - UNSW Online, accessed on March 20, 2025, https://studyonline.unsw.edu.au/blog/data-ethics-overview
92. 3 ethical considerations for data collection - TPXimpact, accessed on March 20, 2025, https://www.tpximpact.com/knowledge-hub/insights/ethical-data-collection
93. Understanding the Ethics of Data Collection and Responsible Data Usage, accessed on March 20, 2025, https://www.ucumberlands.edu/blog/understanding-the-ethics-of-data-collection
94. Ethical considerations in data collection and analysis | Data, Inference, and Decisions Class Notes | Fiveable, accessed on March 20, 2025, https://library.fiveable.me/data-inference-and-decisions/unit-13/ethical-considerations-data-collection-analysis/study-guide/ChTU2xSzGvmsYHZM
95. Data Analytics Case Studies & examples for various Industries - ScikIQ, accessed on March 20, 2025, https://scikiq.com/blog/data-analytics-case-studies-that-will-inspire-you/
96. 5 Big Data Analytics Case Studies You Should Know - Designveloper, accessed on March 20, 2025, https://www.designveloper.com/guide/big-data-analytics-case-studies/
97. The Difference Between Data Analytics and Data Visualization - RudderStack, accessed on March 20, 2025, https://www.rudderstack.com/learn/data-analytics/the-difference-between-data-analytics-and-data-visualization/
98. Data Collection Techniques - Management Concepts, accessed on March 20, 2025, https://managementconcepts.com/course/id/4610/